Compliance Operations Metrics for Tax Firms
Measure throughput stages, turnaround delays, and error clusters to fix operations.

Throughput metrics: how much work the firm actually moves
Throughput is the number of returns, engagements, or compliance tasks completed per period, per staff member or team. The operational reality underneath it isn't clean.
A firm can appear fully staffed and still carry serious throughput bottlenecks that stay invisible until deadlines begin slipping. The diagnostic value lives in the sub-metrics: returns completed per preparer per week, the ratio of engagements in progress to engagements closed, and WIP aging. Volume figures alone support neither capacity planning nor load balancing, and firms that rely on them discover their problems at the worst possible moment in the filing cycle.
WIP aging is the metric that separates firms that understand their pipelines from firms that only think they do. How long an engagement sits open before it closes reveals where handoffs stall, independent of whether total volume looks healthy. A swelling WIP queue with slow aging is a workflow problem, not a capacity problem, and the remedies point in entirely different directions. Firms that track only completed volume never see the distinction and keep applying the wrong fix—usually hiring—when the actual problem is a handoff that nobody owns.
Hours per client functions as a useful throughput proxy. Benchmarks for standard individual compliance work place annual hours around 10 to 15 per simple return. Deviation above that range signals something specific: scope creep, inefficient intake, or repeated review cycles that shouldn't have been necessary. Deviation below that range isn't automatically good news: compressed hours can mean work is being rushed rather than done efficiently, and that distinction surfaces in the accuracy data.
Throughput metrics operate at two levels simultaneously. Firm-wide, they support capacity planning across filing seasons. At the individual level, they enable load balancing before a preparer is already underwater. Neither function is served by aggregate volume figures alone.
Turnaround time and where delays actually originate
Turnaround time is elapsed days from engagement open, or from document receipt, to filing-ready or filed. Most firms track this number in a way that tells them nothing about which part of their operation is causing it.
The version that actually informs decisions disaggregates turnaround into its stages: time in intake, time awaiting client documents, time in preparation, time in review, time awaiting client approval. Each stage has a different owner and a different remedy when it runs long. Total turnaround time without that decomposition is a symptom report, not a diagnosis.
The practical approach is to establish baselines by return type, then track variance from baseline rather than just absolute time. A simple individual return taking twice its baseline is a fundamentally different signal than a complex partnership return running 15% over. Without baselines broken down by return type, the data generates meetings rather than decisions.
The scale of improvement available through process and tooling changes alone is larger than most firms assume before they measure it. Market Growth Reports (2024) found that tax software reduces client turnaround time by 27% and increases accuracy by 23%. That 27% improvement arrives before you touch headcount, which should reorder how firms sequence their improvement investments. Most sequence it last.
Turnaround also connects to client retention in ways the industry persistently underappreciates. A return that's technically accurate but chronically late communicates something to the client about the firm's operational condition. Treating turnaround as a purely internal efficiency metric misses half of what it's measuring.
Accuracy metrics and what error rates are actually measuring
In the Thomson Reuters Institute's July 2024 survey, accuracy of tax filing was the top KPI, cited by 90% of respondents. Despite that near-universal priority, most firms track accuracy only at the outcome level: notices received, audits triggered, amended returns filed. These signals matter, but they're months late by the time they arrive, and the cost has already been paid.
Process-level accuracy metrics surface problems earlier. Error rate per return at the review stage, number of review cycles required before sign-off, and volume of client queries generated post-delivery are all available in real time and almost universally underutilized.
Review-cycle count is the most diagnostic early signal most firms are sitting on. Returns requiring three or more passes through review indicate something is broken upstream—poor intake data quality, a misunderstood preparation scope, or an engagement setup that failed to capture complexity. Without cycle count data, firms persistently misdiagnose review capacity as the problem when intake process is the actual cause and hire reviewers to no effect.
Enterprises using AI-integrated systems reported 33% fewer notices from tax authorities, per Market Growth Reports (2024). Notice rate tracked over time is a legitimate downstream accuracy measure, and a reduction of that magnitude represents a real change in both client outcomes and firm risk exposure.
The most diagnostic question is whether errors cluster. If error rates concentrate around specific return types, certain client profiles, or a subset of preparers, the pattern points to a process gap rather than individual underperformance. Responding to clustered errors with individual coaching treats the symptom. Mapping error patterns to workflow stages and intake protocols addresses the cause. Rework and amended filings consume hours that are typically unbillable, which means accuracy isn't only a quality metric—its cost surfaces directly in the financial metrics reviewed later in the cycle.
Capacity utilization and what billable hours don't tell you
Utilization rate is the percentage of available staff hours spent on billable client work. Its inverse, the share absorbed by non-revenue activity, is equally informative and far less commonly tracked.
SPI's 2025 PS Maturity Benchmark identifies 70 to 80% utilization during peak season as the range associated with profitability and sustainability. Below 70%, capacity is being wasted on non-billable overhead or misallocated to staff whose skills aren't matched to the work in front of them. Sustained above 80%, quality begins to degrade and the organization is consuming reserve capacity that exists for a reason. The number alone doesn't tell you which direction the problem is pointing.
The Thomson Reuters Institute's July 2024 data adds something that routinely gets lost in the headcount conversation. Technology and automation constraints were cited as the top impediment to achieving compliance goals by 40% of respondents; resource constraints were cited by 39%. Those figures are essentially tied. Adding people to a workflow burdened by manual overhead buries the inefficiency under more people doing slow work, and the utilization number will actually improve while the operational problem compounds.
Harness has noted that firms where administrative expenses exceed 40% of revenue are typically experiencing significant process inefficiency. At that threshold, non-billable overhead is structurally crowding out the utilization that generates margin.
Utilization must be tracked by role to mean anything. A senior reviewer at 90% sustained utilization is a bottleneck accumulating in real time: the preparation pipeline behind that reviewer slows, review cycle times lengthen, and turnaround extends — all while the aggregate utilization figure looks fine. A preparer at 50% signals misallocation of a different kind. Firm-wide averages can mask both conditions simultaneously, which is why the aggregate number alone generates no actionable information.
Realization and write-off rates as a check on operational efficiency
Realization rate is revenue actually billed and collected as a percentage of the value of work performed. Write-off rate is the percentage of WIP or billed time ultimately written off. Together, they're the financial translation of everything that went wrong earlier in the workflow, rendered visible only after the damage is done.
AccuLink CPA benchmarks healthy realization for CPA firms at 85 to 95%. Below 80%, the compliance operation is effectively subsidizing clients through unrecovered labor. FirmLever's benchmarks identify write-off rates under 5% as healthy, 5 to 10% as a signal requiring attention, and above 10% as an indicator of serious structural problems in pricing, staffing, or client selection.
Write-offs are recorded at billing, but they're created at intake, preparation, and review. Scope creep that wasn't captured at engagement setup, rework generated by accuracy failures, complexity underestimated when the matter was first opened—these are the culprits. Treating elevated write-offs as a billing problem—by adjusting rates or tightening write-off approval authority—is a common response and reliably ineffective.
Firms that track realization without understanding its operational drivers will eventually respond to declining realization by cutting prices or reducing staff. Reduced prices compress margin without addressing throughput inefficiency. Staff reductions increase load on remaining capacity, which accelerates the accuracy and review-cycle failures that generated rework costs in the first place. The mechanism is self-reinforcing, and firms that stay in it long enough don't identify the entry point until they're well inside it.
How the metrics interact and what the pattern reveals
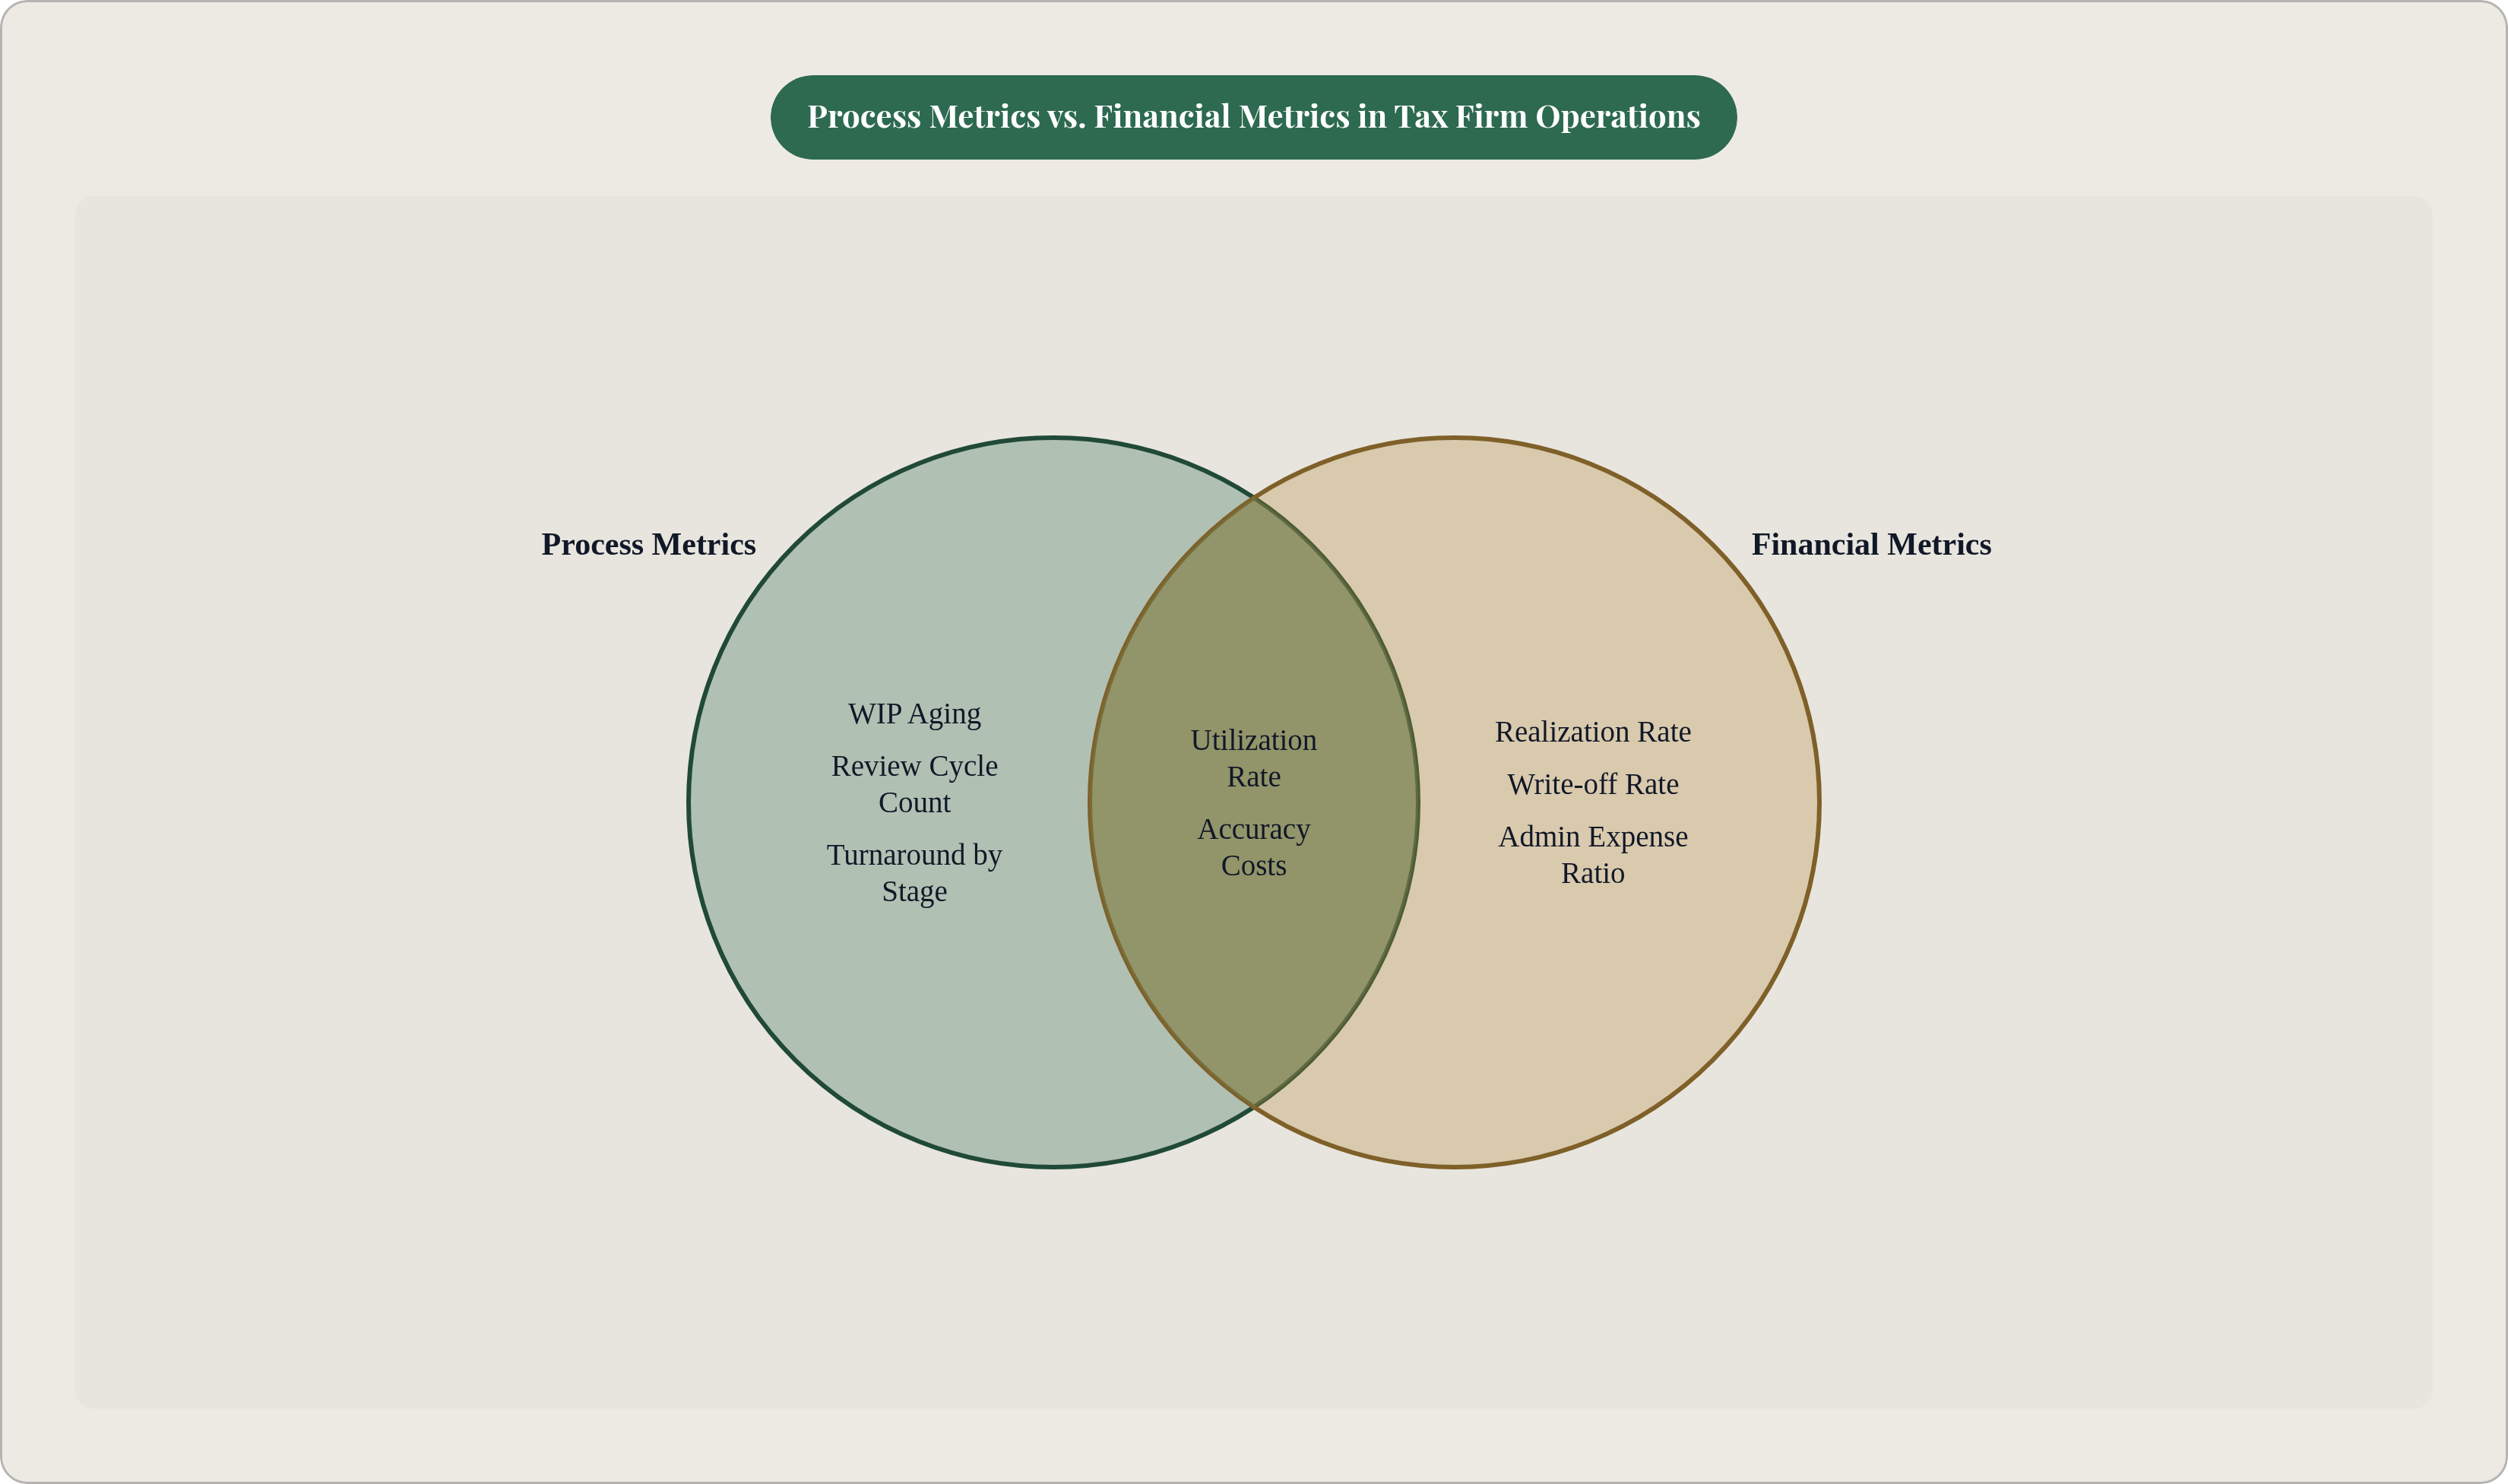
No single metric is sufficient for operational diagnosis. The value of tracking these measures as a set is that patterns across them point to specific failure modes with a precision that no individual measure can provide.
Three patterns recur in practice. High throughput paired with high write-offs and declining realization means the firm is moving volume but absorbing scope it isn't recovering in billing; the failure is at intake scoping or billing discipline, not preparation capacity. Low utilization combined with long turnaround and high review cycles means capacity is nominally available but stuck waiting—in review queues or on client documents—which is a workflow design and document management problem rather than a headcount problem. Good utilization and adequate realization alongside a rising administrative expense ratio means the firm is managing its current load, but non-billable overhead is scaling alongside revenue and will erode margin as the firm grows. Each of these points intervention to a different part of the organization, which is the entire point.
AccuLink CPA's guidance holds that utilization, turnaround time, and error rates should be reviewed monthly, while financial KPIs like realization are reviewed quarterly. Monthly review of process metrics enables intervention within the same filing cycle. Quarterly review of financial metrics provides confirmation of whether process changes are working. The sequencing matters because the process metrics lead the financial ones—by the time realization declines, the process failure that caused it is already several months old.
Where automation changes what these metrics can show
Every metric in this framework can be tracked manually, but in practice manual tracking is expensive, inconsistent, and usually incomplete by the time it reaches anyone with authority to act on it.
Automation already affects several of these metrics directly and measurably. Market Growth Reports (2024) documented cycle time reductions of 38% and a 33% reduction in tax authority notices in enterprises with AI-integrated compliance systems. These are structural shifts in what the baseline looks like, and they change what "normal" means for every metric in the framework. Firms still measuring themselves against pre-automation benchmarks are managing to the wrong targets, and the gap between their performance and the available benchmark will continue to widen regardless of how diligently they optimize within the old parameters.
Thomson Reuters' 2025 Future of Professionals Report found that 79% of tax, audit, and accounting professionals expect AI to have transformational impact within five years, yet only 14% of tax firms currently have a defined AI strategy. Wolters Kluwer's 2025 Future Ready Accountant Report found that AI-powered tax research tools free up to 3.5 hours per week per professional and increase client capacity by as much as 55%—a direct throughput and utilization effect that compounds across a filing season in ways that become unmistakable in the data.
What the metrics framework provides, in this context, is the ability to make automation decisions on evidence rather than instinct. If review cycles are the bottleneck, the logical intervention is automating document validation upstream, before returns reach the review stage. If utilization is suppressed by administrative overhead, the target is intake automation and status tracking. The metrics identify where process leverage is highest; automation delivers it. Without the metrics, intervention decisions rest on whoever makes the most compelling argument in the room—a fine approach until the filing season ends and someone asks you to justify what you spent.