Measuring Tax Workflow Automation Effectiveness
Standard tax metrics miss whether automation actually freed skilled staff for higher-value work.

What the Standard KPI Set Captures and What It Misses
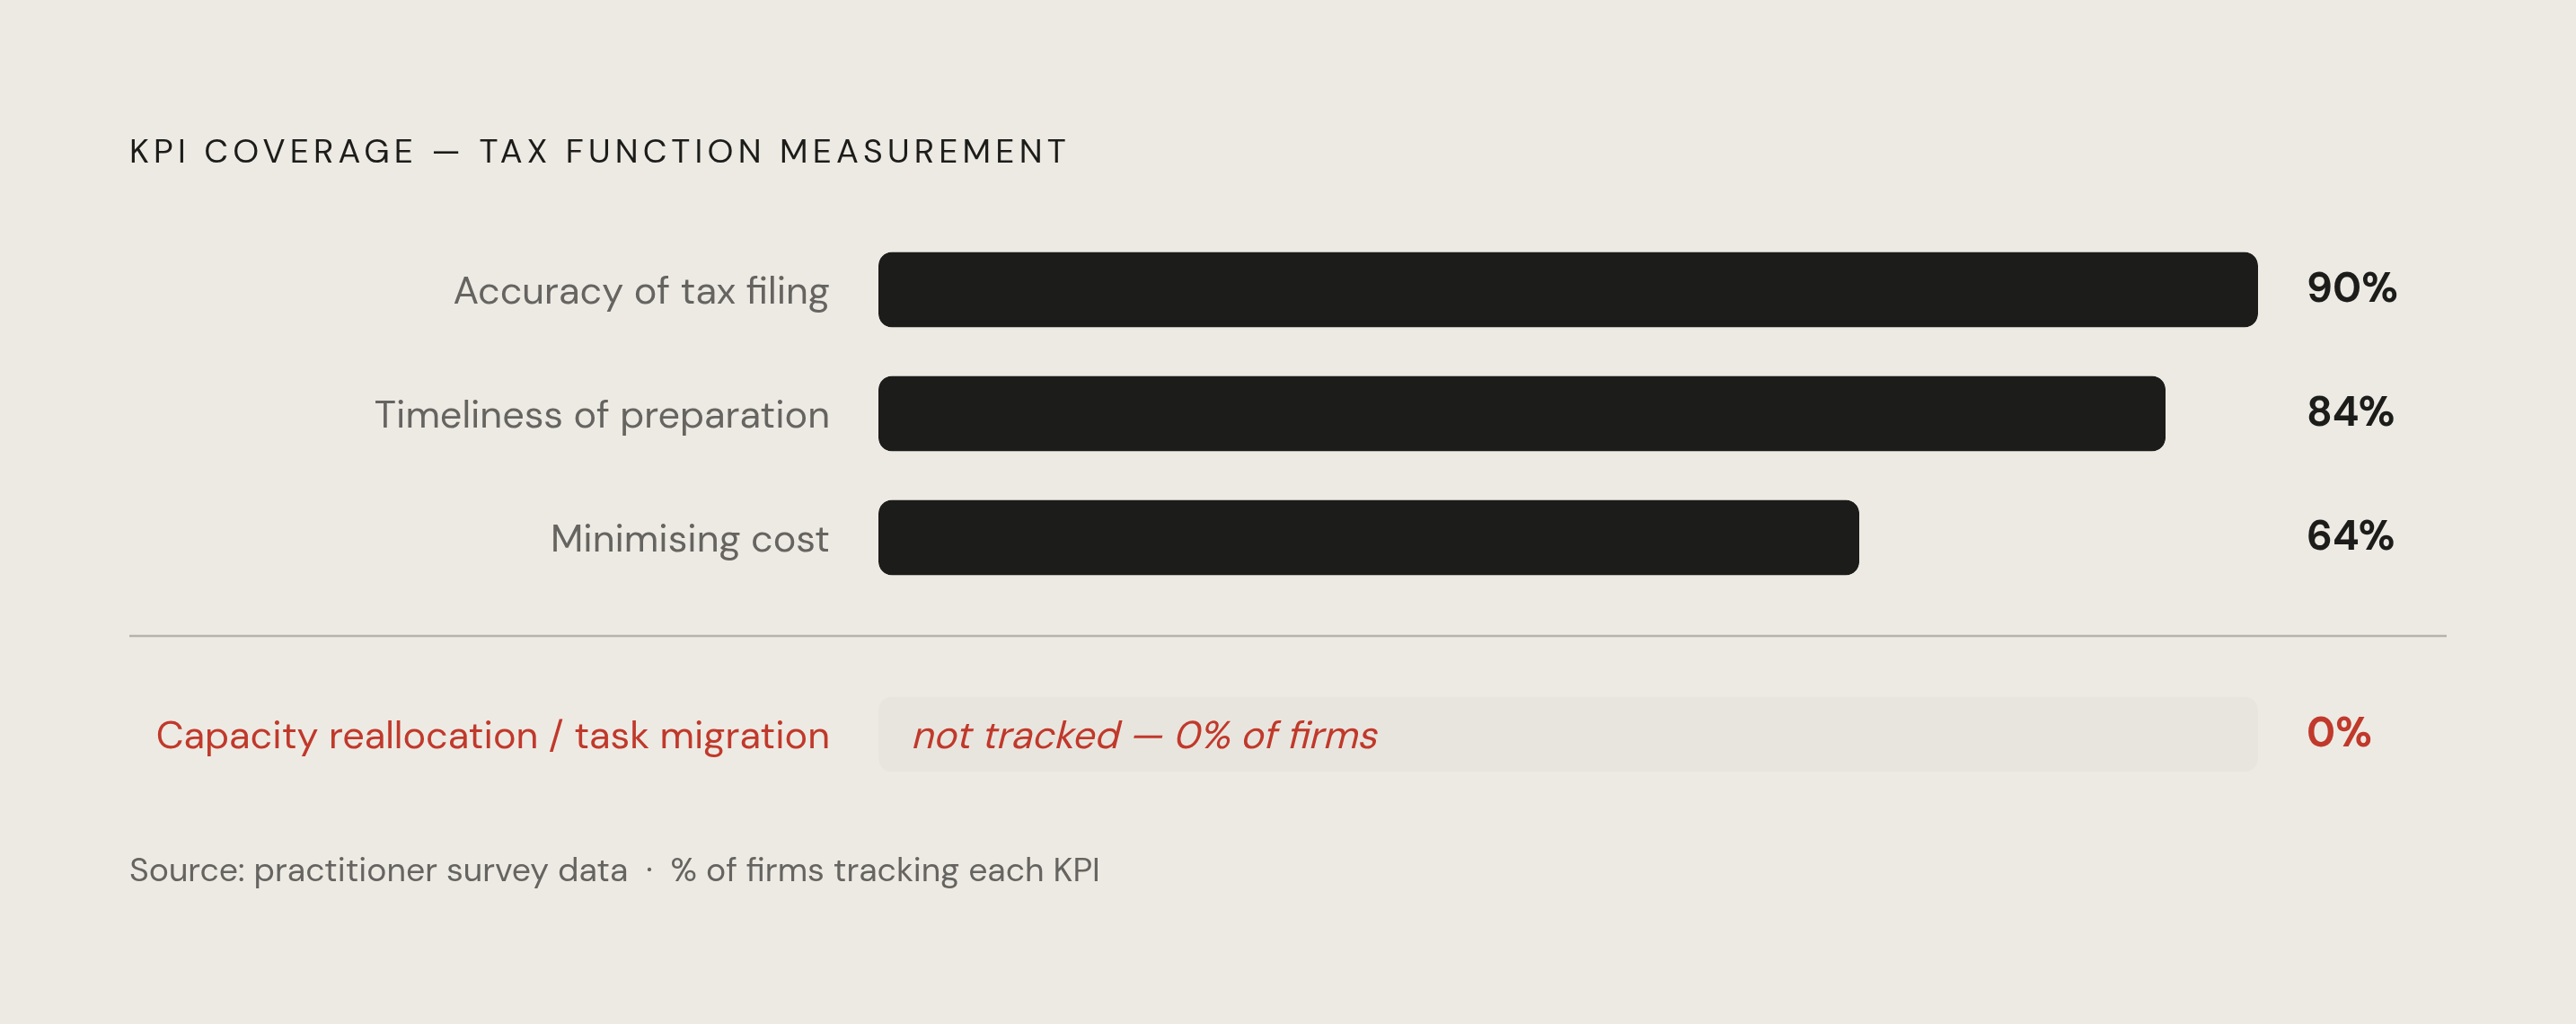
The Thomson Reuters Indirect Tax and Compliance report found that tax departments track an average of six KPIs. The three most common are accuracy of tax filing, cited by 90% of respondents; timeliness of tax preparation, cited by 84%; and minimizing cost, cited by 64%. These are real metrics. They are also compliance-anchored almost without exception, telling a firm whether filings went out correctly and on time. They say nothing about whether the professionals who produced them were operating anywhere near the ceiling of their training.
Effective Tax Rate sits alongside these as a legitimate financial indicator for CFOs. As a window into operational capacity, it is nearly useless. A firm can maintain a favorable ETR while its senior accountants are buried in data entry, and the number won't surface that condition. Nothing else in the standard set will, either.
What's missing is any measure of task migration. A firm can hit 90% filing accuracy and strong timeliness while CPAs are still doing work a properly configured workflow system would handle without them. The standard KPI set reflects a compliance-era mental model, built when the primary question was whether work got done, not who was doing it or whether that labor was appropriately matched to skill level. It needs a second tier built around what practitioners are actually doing with their time. Whether the returns went out clean is not enough.
How to Establish a Baseline Before Automation Changes Anything
Firms most reliably skip the baseline conversation. Without a pre-automation accounting of how staff time is distributed across task types, every subsequent measurement is impressionistic. You cannot demonstrate change you did not first document.
The data that belongs in a baseline is concrete: staff hours broken down by category, including intake, data extraction, validation, review, client communication, and advisory work; error rates by task type; overtime hours by period; and return volumes per preparer. The AICPA's 2025 Technology Survey found that the average CPA firm spends between 23% and 31% of billable staff time on administrative tasks automation can eliminate. Most firms do not know their own number before implementing. Post-automation comparisons without this starting point are guesses, however confident the people making them may feel.
Baseline-setting also surfaces something vendors won't flag. Some tasks that look routine are not. A step that appears repetitive may carry judgment dependencies that make full automation inappropriate, and the time to discover that is before implementation, not after a failed attempt that costs credibility with the staff who must live inside the resulting system.
There is also a sequencing principle that deserves direct statement. Automation accelerates and codifies existing processes. If a workflow carries ownership ambiguities or handoff failures, automation makes those failures faster and more consistent. Resolve process problems first, then automate where manual effort is highest and consistency matters most. Firms that reverse this order often find themselves carefully measuring an automated version of a broken process, which is a different problem entirely and a considerably more expensive one.
The Metrics That Reveal Whether Skilled Work Is Actually Shifting
The metric a functioning framework most needs is capacity reallocation rate: the percentage of hours previously spent on intake, data extraction, and validation that have demonstrably shifted toward review, advisory, or client-facing work. The calculation is not complicated. It requires a decision to collect the data that makes it computable — and in most firms, that decision is the actual obstacle.
In a well-automated return workflow, the system handles extraction, basic validations, form population, and status tracking. Practitioners handle judgment, review, and client communication. A firm should be able to state, with actual numbers, what proportion of preparer time now falls on the judgment side of that line. If the proportion hasn't moved materially after implementation, automation has produced operational efficiency without producing practitioner capacity. Conflating those two outcomes is among the more expensive mistakes a firm can make, and it happens routinely because both can coexist with on-time filings and clean accuracy numbers.
Advisory revenue per staff member is the commercial expression of the same shift. AICPA data from 2024 found that 78% of firms deploying comprehensive automation grew revenue per staff member rather than reducing headcount. That result reflects what happens when practitioners have real discretionary time to convert compliance relationships into advisory ones. The firms that achieved it measured for it and managed toward it. The ones that didn't often assumed the shift would happen organically once the automation was in place. It doesn't.
Throughput per preparer without overtime captures capacity expansion without conflating it with overextension. A firm that hits filing targets by running staff into the ground has gained nothing durable. Thomson Reuters data shows that firms using automated capacity planning achieve 95% on-time filing rates while reducing seasonal overtime by 30%, a combination that reflects structured capacity rather than borrowed capacity. The difference matters when you're planning for the following year.
Staff retention belongs in this tier as a lagging indicator of genuine workload change. The AICPA found that 67% of accounting staff who left firms in 2024 cited excessive administrative burden as a contributing factor. A sustained drop in voluntary turnover among skilled staff is evidence that the nature of their work has changed, not just the pace of it. Collecting these metrics requires pulling from workflow data, billing records, and HR systems simultaneously. That is not technically complex. It requires someone to own the result and decide it is worth the coordination.
Where ROI Calculations Undercount the Real Return
A Forrester Consulting study commissioned by Thomson Reuters found that organizations implementing automated direct tax software achieved 148% ROI and $1.7 million in net present value over three years, with payback in under six months. Those figures make the case comfortably. The problem is that most firms conducting their own analyses arrive at considerably smaller numbers, because they are counting a narrower set of outcomes.
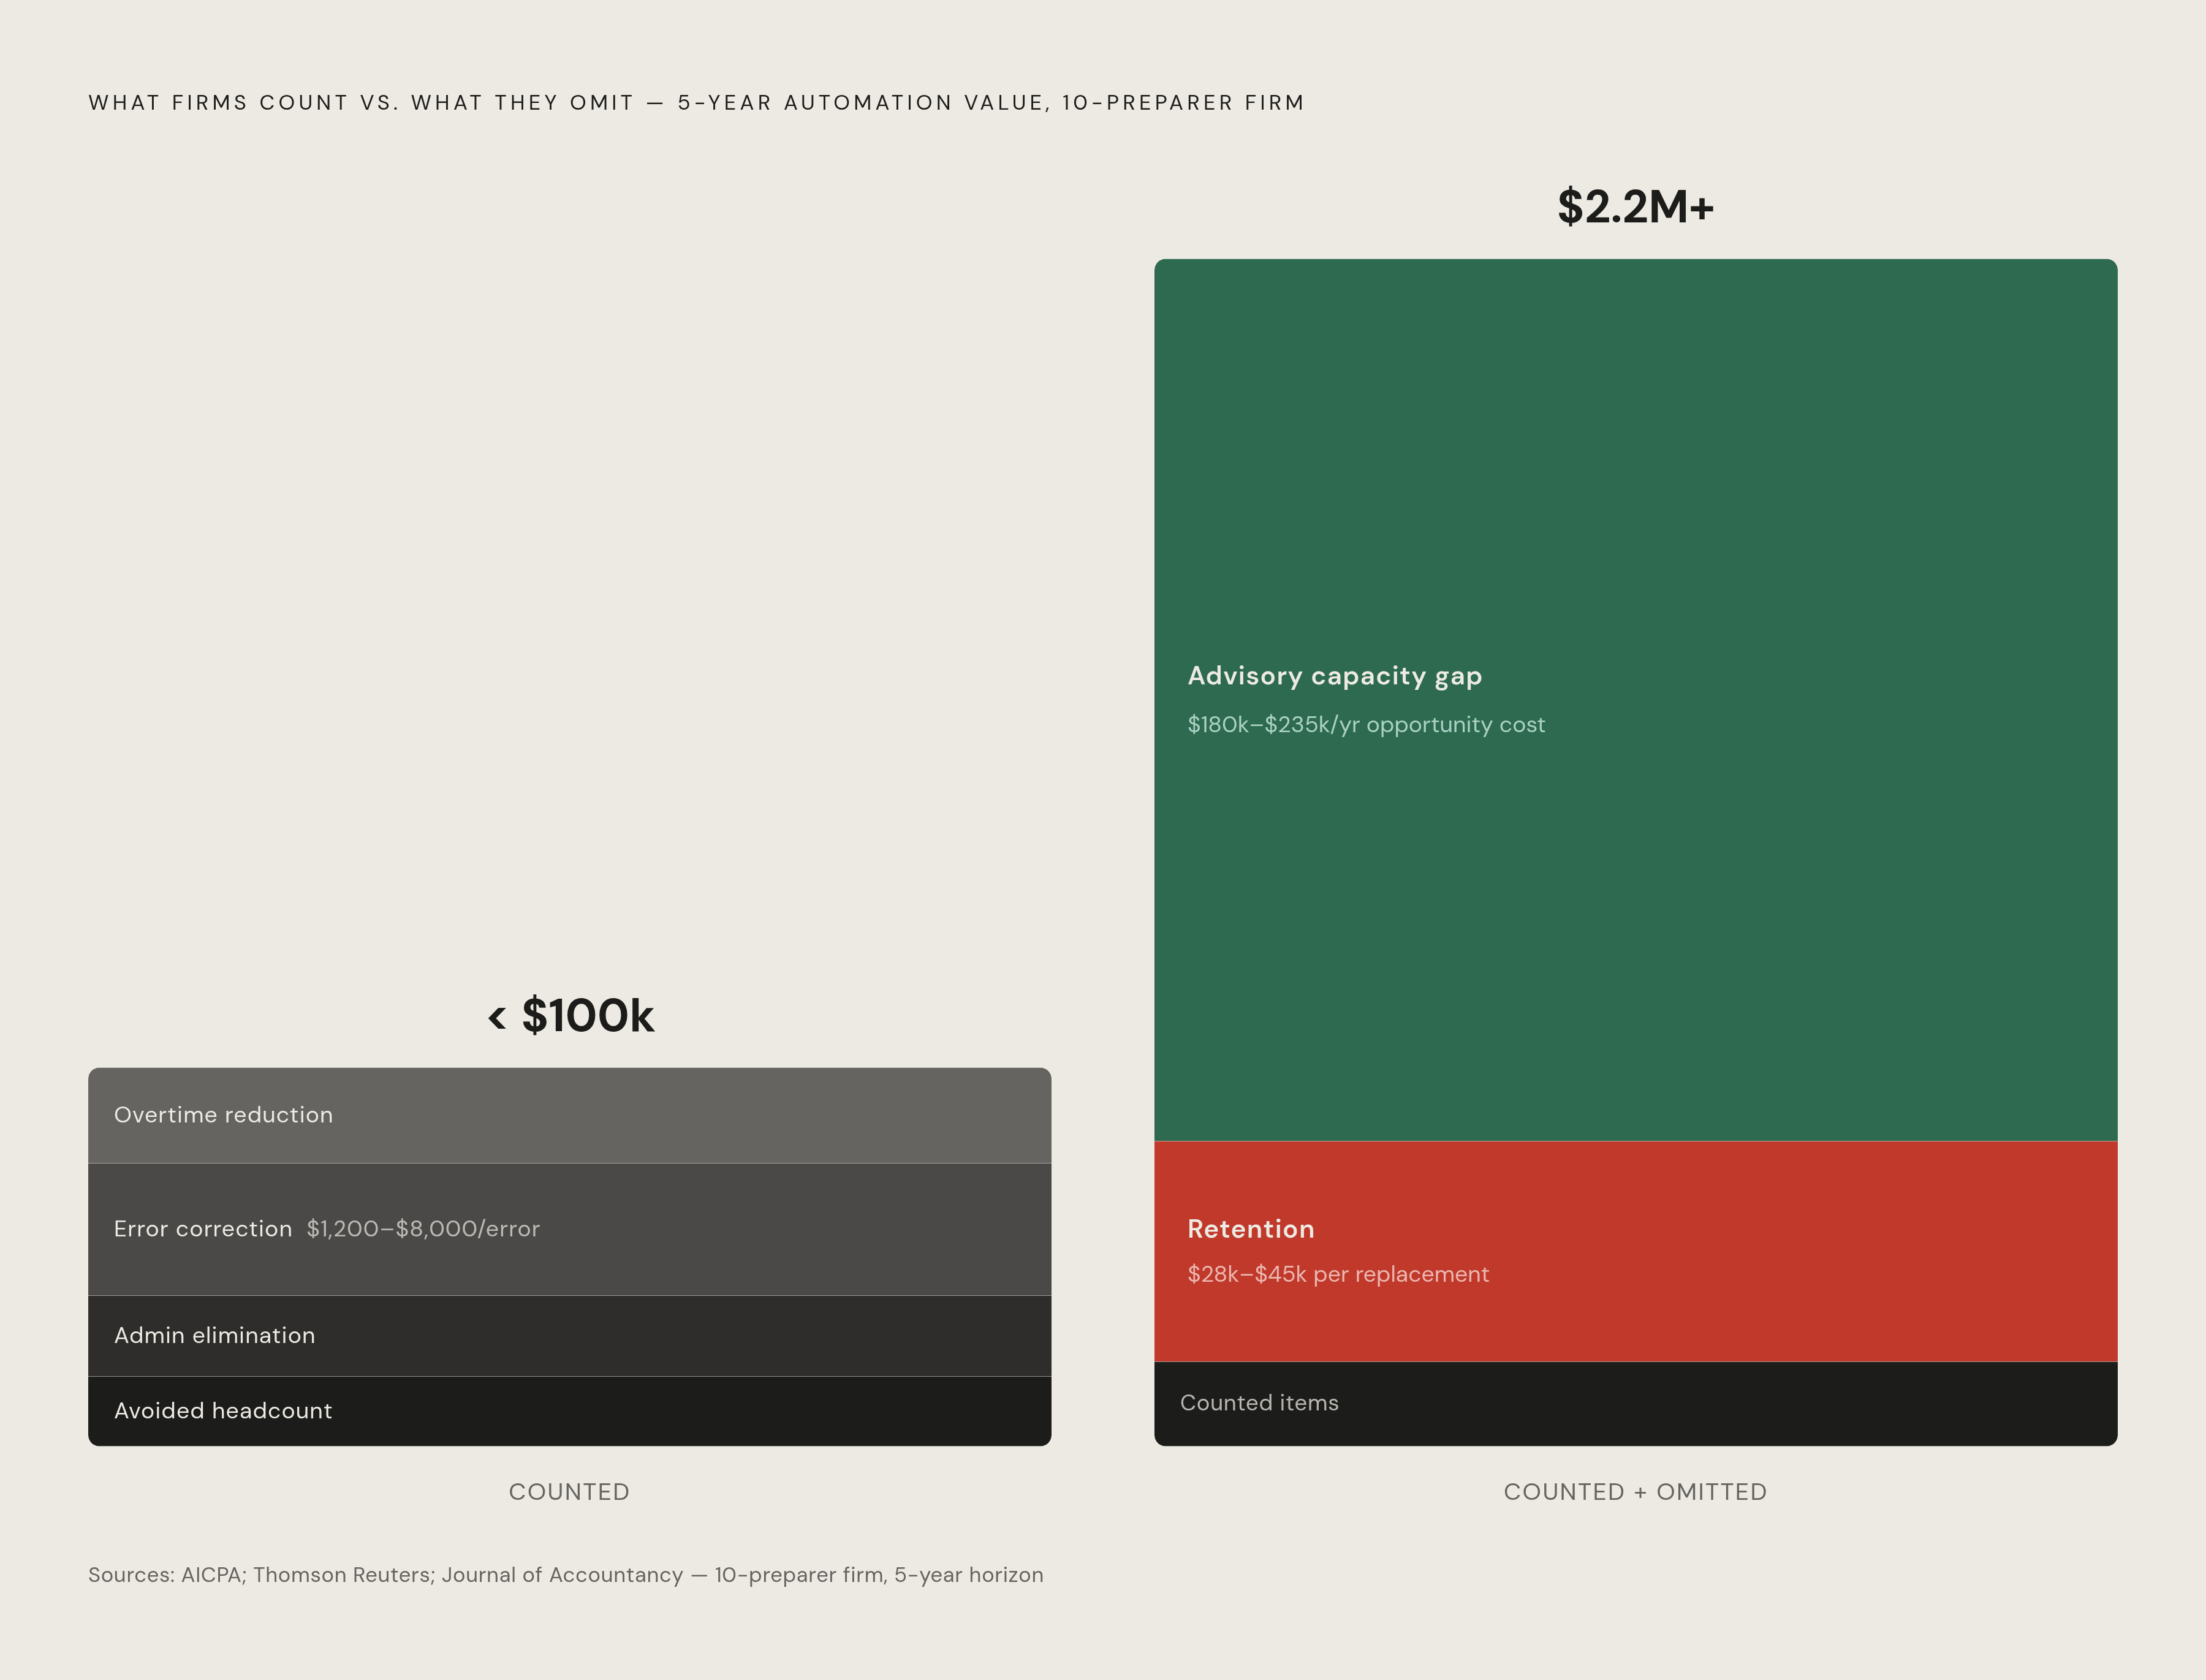
Standard models include overtime reduction, error correction costs, administrative expense elimination, and avoided headcount additions. Accounting Today places error correction costs between $1,200 and $8,000 per prevented error. These figures are legitimate. They are also incomplete. The part they omit is usually the largest.
What most models leave out is the opportunity cost of skilled staff doing routine work. For a ten-person firm billing at professional rates, the AICPA estimates that administrative hours represent between $180,000 and $235,000 annually in time that could have been deployed on advisory work. That number never appears on any invoice. It lives in the gap between what practitioners billed and what they could have billed with differently allocated capacity — which is precisely why surfacing it requires deliberate measurement. Passive accounting will not find it.
Turnover cost is similarly underweighted. Thomson Reuters benchmarks replacing a senior accountant at between $28,000 and $45,000, accounting for recruiting, onboarding, and lost productivity during transition. A single prevented departure offsets twelve to eighteen months of automation subscription costs. Firms rarely build this into their models, despite the fact that retention improvement is one of the more documentable downstream effects of genuine capacity relief.
The Journal of Accountancy has published analysis showing that for a ten-preparer firm, cumulative five-year value from automation can exceed $2.2 million against an initial investment in the low five figures, once advisory capacity gains are included alongside direct savings. A pure cost-reduction frame will miss that conclusion systematically. The practitioner capacity gains are the most durable part of the return, and the most common casualty of how firms choose to count.
Error and Compliance Metrics That Automation Makes Newly Trackable
A 2024 Gartner survey found that 18% of accountants make financial errors at least daily; a third make errors weekly. Most firms absorb this as background noise because manual workflows don't generate the data needed to trace error origins. You cannot analyze what you cannot see, and manual processes mostly keep errors invisible until they become penalties.
Automation changes the landscape of what is visible. A structured workflow creates an audit trail that manual processes cannot produce. Firms can now track where in the return preparation sequence errors originate, which review stages catch them, and what conditions correlate with elevated rates. Accounting Today data shows that returns completed under capacity strain carry an error rate 3.2 times higher than returns completed within normal workload bands. Error rate variance by period is therefore not only a quality measurement; it is a proxy for capacity stress. A spike in errors during peak season, visible against a workflow baseline, tells you that volume exceeded sustainable capacity before the penalties arrive to tell you the same thing.
The Thomson Reuters 2025 State of the Corporate Tax Department report found that at least half of respondents from under-resourced departments had incurred tax penalties in the past year, compared to roughly one-third from adequately resourced departments. Penalty incidence tracked over time is a direct output of accuracy, capacity, and staffing combined. It is also one of the cleaner metrics available because it requires no self-reporting.
Avalara and Hanover Research found in 2025 that 58% of organizations using AI in tax functions self-reported improved accuracy, with 28% citing better compliance and risk management. Self-report is a starting point. The more defensible approach tracks penalty incidence and error origin data directly from workflow systems, where results don't depend on how practitioners remember their own performance. That level of rigor is newly accessible in most tax departments precisely because automation has created, for the first time, a record worth interrogating.
Why Measurement Frameworks Break Down in Practice and How to Keep Them from Drifting
EY has identified poor data quality and system fragmentation as the primary reasons AI adoption stalls in tax functions. The same conditions make measurement unreliable before the question of interpretation ever arises. Capacity reallocation rate cannot be tracked if time data lives in one system, billing data in another, and workflow data in a third, with no integration between them. Fifty-eight percent of organizations report struggling with legacy system integration, which means a substantial share of firms designing measurement frameworks will hit data access problems before they ever reach the question of what the data means.
Stakeholder alignment is a second failure mode, and easier to overlook because it is organizational rather than technical. CFOs read automation value through cost reduction. Partners read it through client service capacity. Staff read it through whether their days feel materially different than they did before. A framework that surfaces only one of these perspectives will eventually lose the others' confidence, and a measurement framework nobody trusts doesn't get used. The technical design can be sound; the framework still dies if it stops being legible to the people who need to act on it.
Deloitte's Tax Transformation Trends research notes that deployments focused on solving specific, named business problems yield better engagement and ROI than tools introduced without clear guidance. The same logic applies directly to metrics: define what question each metric answers before you start tracking it. A metric without a defined question becomes data no one bothers to open.
Beyond design, metrics need review cadences tied to the tax season cycle rather than annual retrospectives that arrive too late to inform decisions. They need designated owners by role, not collective responsibility that distributes into no responsibility. When a metric stops moving after the first year, that stagnation warrants investigation. It usually means the workflow change did not reach the staff it was designed to reach, and passive continued collection is not an adequate response.
What a Functioning Measurement Framework Looks Like Across a Firm's Maturity Stages
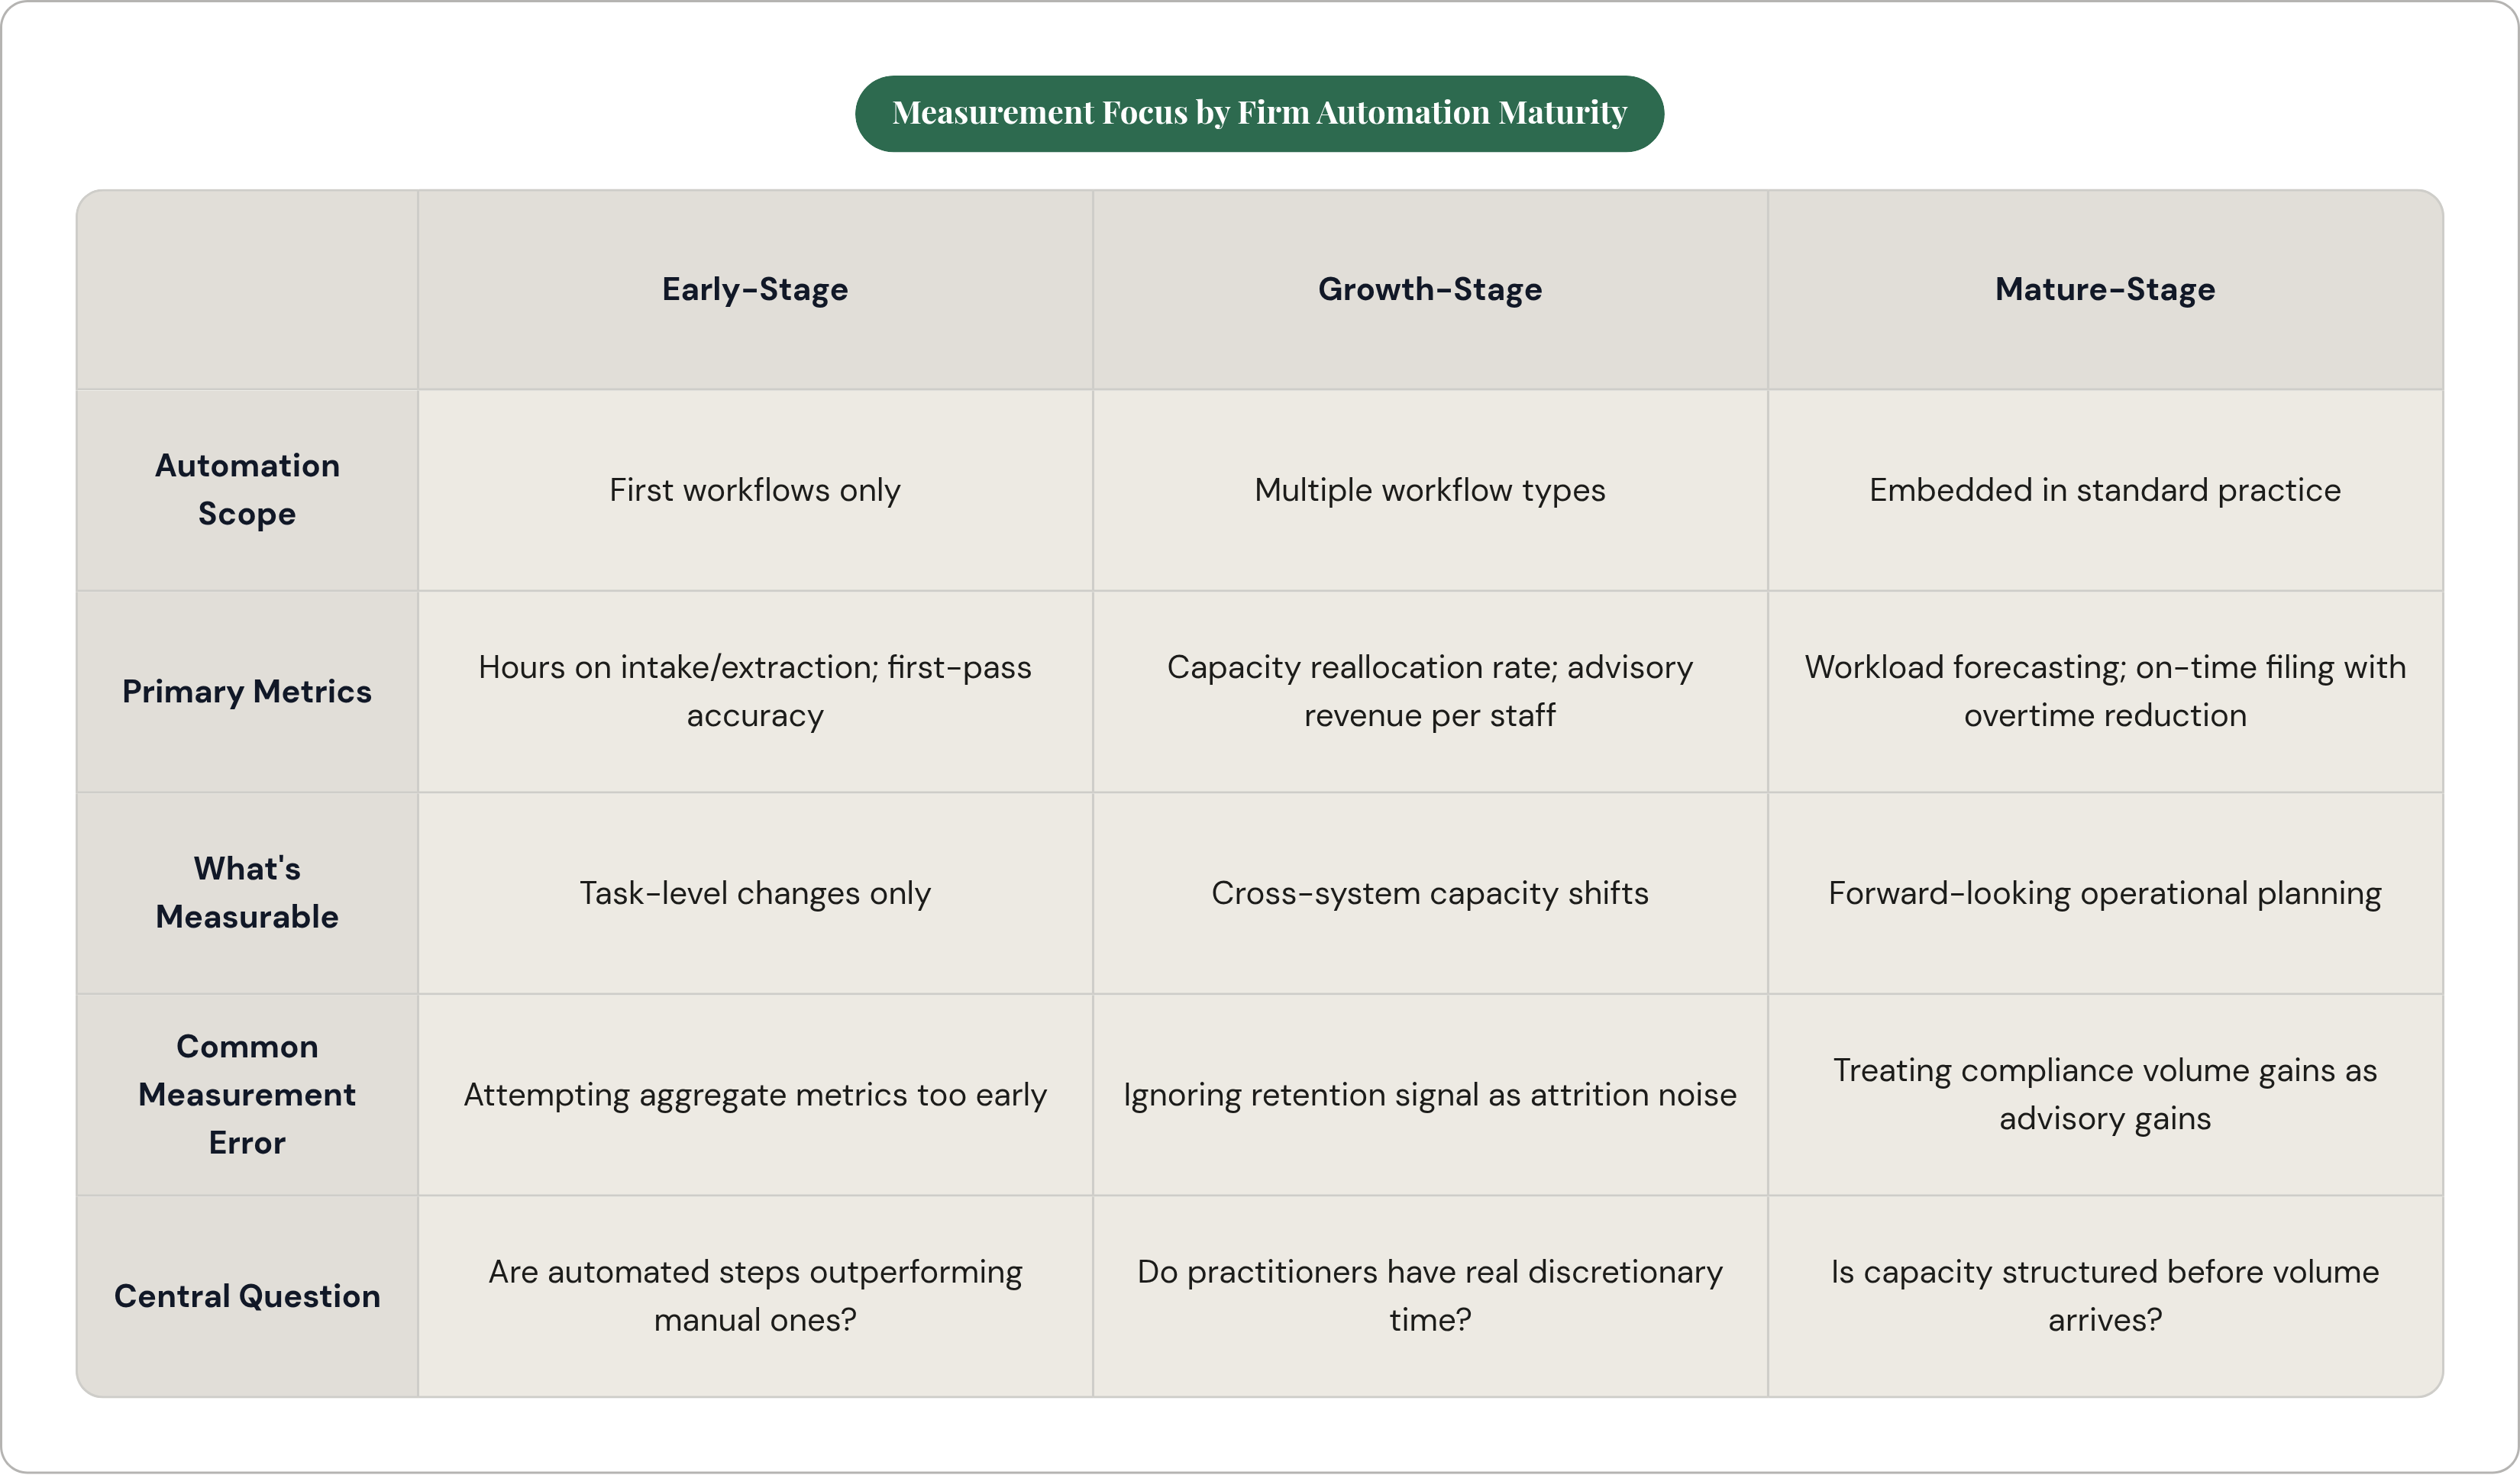
Early-stage firms, those automating their first workflows, should measure at the task level before attempting to aggregate upward. The questions at this stage are specific and direct: are hours on intake and data extraction declining, and is first-pass accuracy on automated steps higher than on manual equivalents? Aggregate metrics like capacity reallocation rate are not yet meaningful because automation scope is too narrow to systematically change how practitioners allocate their days. Attempting to measure reallocation before enough workflows are automated to generate reallocation is a measurement error. It produces the appearance of null results where the actual finding is premature inquiry.
Growth-stage firms, with automation running across multiple workflow types, can meaningfully introduce capacity reallocation rate and advisory revenue per staff member. These metrics require cross-system data, but they become interpretable once automation is broad enough that practitioners have genuine discretionary time and a real choice about how to deploy it. Staff retention data also accumulates enough longitudinal signal at this stage to be read as something other than ordinary attrition variation.
Mature-stage firms, those with automation embedded in standard practice, shift measurement toward the forward-looking. Workload forecasting data, used to match preparer capacity to return volume before peak season begins, reflects automation operating at the level of operational planning rather than task execution. Thomson Reuters data shows firms at this stage achieving 95% on-time filing rates with 30% less seasonal overtime. That combination reflects capacity structured before the volume arrives, not assembled under pressure after it already has.
Across all three stages, the central question stays fixed: not whether automation saved time, but whether practitioners are moving toward higher-value advisory work or simply absorbing more compliance volume at a faster rate. A firm that treats those as interchangeable will build a practice shaped by the second while believing it has built one shaped by the first. Measurement — sustained from the beginning and honest about what it finds — is the only reliable way to know which you actually have.